Loss waterfall and donut
The fifteen-step loss decomposition and how to read it.
Reviewed
What this is for
Why the year is not the nameplate times 8,760. Fifteen steps, one order, stored with the run. The donut is the same losses cut by cause rather than by sequence. Both views are built from one set of numbers, so they reconcile.
The waterfall is a report of the solved year, not a chain of derates applied to a guess. Inventing your own chain of multiplications is how the two charts disagree.
Steps
- Open a finished result. Loss waterfall is the sequential view. Steps 1 to 6 are irradiance (
kWh/m²), averaged across every module. Step 7 turns the nameplate loose on that; everything after is energy (kWh). The two chains share the column and not the scale.
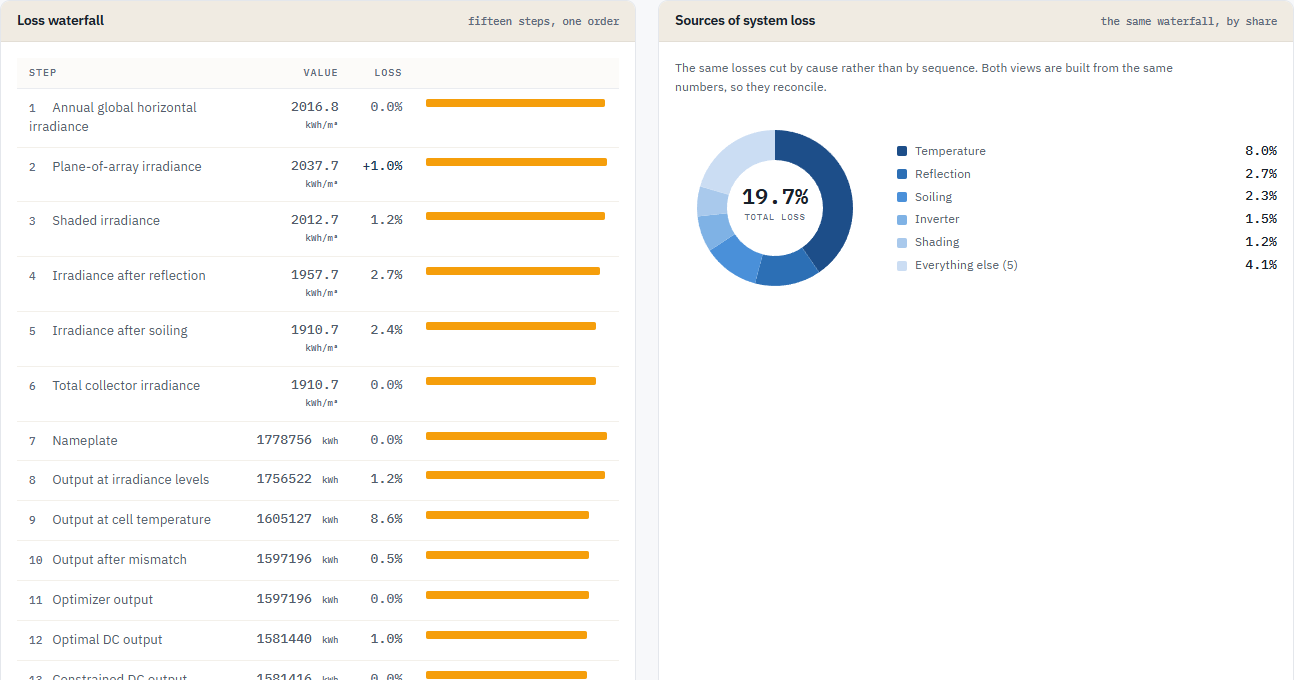
- Each loss is measured against the step above it, so the column multiplies rather than adds. Summing it overstates the total. The figure at the bottom is the only total there is.
- Three steps mislead if you only read the bar:
- Plane-of-array irradiance is normally a gain. A tilted plane collects more than a flat one. A loss here means the array faces away from the equator. The plane this run transposed onto is listed under the chart (absolute tilt and azimuth, or no facing on a horizontal plane).
- Output at irradiance levels can also be a gain. A datasheet nameplate below what the characterisation produces at standard conditions is the label being conservative, not the model being optimistic.
- Constrained DC output is four causes with four different fixes. They are broken out in the table under the charts. There is no total on that table: it would restate the step.
- Sources of system loss is the donut. Same run, by share.
- A wiring zone with conductor runs and no size chosen produces Optimal DC output at exactly no loss. That is indistinguishable on the bar from perfect wiring. The notice under the chart says so. Pick conductor sizes and re-run.
Until a pairing has been run, there are no charts. The matrix cell says Not ready.
Tips and common mistakes
- Do not add the percentages. They compose.
- Step 2 near zero on a flush commercial roof is a fraction of a percent either way. Look at the plane listed under the chart before assuming an inverted azimuth.
- Under-voltage and over-power are opposite fixes. One percentage cannot tell you which.
- Under-power is not modelled unless the characterisation carries a start-up power. A dash there is "we did not model this", not "it came out at nothing".